Datalog resolution
Datalog resolution
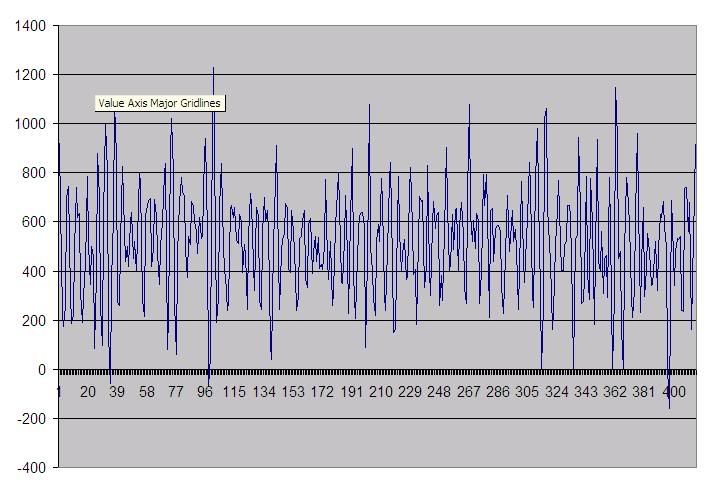
When I export a datalog to a CSV file, the resolution of VSS and RPM are very granular. Would it be possible to increase the resolution of these values to tenths of a MPH and / or 1 RPM? The reason I'm asking is because I'd like to use the datalog to generate a torque curve. As the values are now, you have to average hundreds of frames to get a curve that looks anything like a torque curve. But when I do that, all the real dips and humps in the torque curve are averaged out too.
'06 NFR S2000

That's disappointing, but I guess I can use a higher gear to do what I need. The only downside is the higher possibility of a ticket. Redline in 4th gear is how many MPH?Hondata wrote:The rpm changes about every 5-7 records because of the way the information is read from the ECU in packets.
The ECU only records the speed to 1 kph.
'06 NFR S2000
Re: Datalog resolution
Hey, I wrote my own graphing software that graphs road torque. It's been used by several people on 8thCivic and they absolutely love it. Not having any issues with resolution etc. If you want to post up an S2k 3rd gear WOT pull datalog I'll run it through my app and show you the results.Gernby wrote:When I export a datalog to a CSV file, the resolution of VSS and RPM are very granular. Would it be possible to increase the resolution of these values to tenths of a MPH and / or 1 RPM? The reason I'm asking is because I'd like to use the datalog to generate a torque curve. As the values are now, you have to average hundreds of frames to get a curve that looks anything like a torque curve. But when I do that, all the real dips and humps in the torque curve are averaged out too.
Ignore the CAM portion since your S2k has no VTC (but the FPro logs it so my software tries to graph it).
Also, maybe Hondata can comment, is the Af.Corr value valid in S2000 logs? It seems to be recording something but it's way off from the regular Af value for the S2k. Thats the value my software graphs out of FPro logs.
As for the peak values, I'm not sure your mods so I don't know how legit those are. Also gearing and weight factor into my equations. I'm using a 4.10 final drive and a 1.48 3rd gear. Stock weight + 180lb driver. If the road you were using is even slightly down hill, it'll inflate #'s as well.
Thank you very much for posting that. It has the same general shape as what I've been able to generate, but much much smoother. Of course, the smoothness is what concerns me, since a dyno would probably show a lot of real dips and humps. I'll post some screen shots from mine when I get to work.
BTW, I weigh over 230 lbs naked after a good duece. My mods other than the FlashPro are a PWJDM intake, and some cooling items (1 step colder plugs, high pressure thermostat, 80% water coolant mix, and a slightly hotter thermostat).
BTW, I weigh over 230 lbs naked after a good duece. My mods other than the FlashPro are a PWJDM intake, and some cooling items (1 step colder plugs, high pressure thermostat, 80% water coolant mix, and a slightly hotter thermostat).
'06 NFR S2000
No problemo.
The smoothing is part of the algorithm. I can make the graphs very very smooth. That one has a bit of smoothing, as well an algorithm applied to strip some of the datalogging noise out of the graph.
The peak #'s I'm just curious about because I know S2000's with minimal mods don't dyno that high.
Peak #'s aside, I've found it a very useful app to street tune vehicles. Comes in handy.
Here is what I'm getting without any smoothing at all. This is just a graph of the rate of change in the RPM value over time. I am only filtering out the frames with duplicate RPM values. The unit of the Y access is RPM / Second
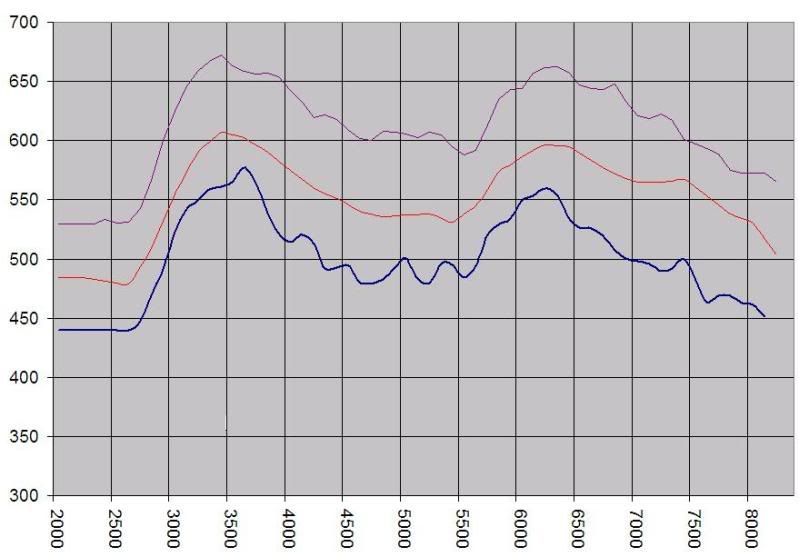
Here is another where I'm doing various amounts of averaging to smooth out the plots. Obviously, I could smooth it more, but it's hard to tell what is too much. I think some of the dips and bumps might NOT be noise. Thoughts?
Here is another where I'm doing various amounts of averaging to smooth out the plots. Obviously, I could smooth it more, but it's hard to tell what is too much. I think some of the dips and bumps might NOT be noise. Thoughts?
'06 NFR S2000
Yeah, that's terribly jumpy. BTW, I wrote my trimming algorithm as such:Gernby wrote:Here is what I'm getting without any smoothing at all. This is just a graph of the rate of change in the RPM value over time. I am only filtering out the frames with duplicate RPM values. The unit of the Y access is RPM / Second
Code: Select all
if (next_RPM <= last_used_RPM) then
  skip_next_rpm
else
  save_next_RPM_datalog_data
  last_used_RPM = next_RPM
2475
2475
2435
2535
2536
etc... It helps ditch the stragglers like '2435' that don't belong.
See above related to dips/bumps. Those straggler points cause a lot of jaggedness.Gernby wrote: Here is another where I'm doing various amounts of averaging to smooth out the plots. Obviously, I could smooth it more, but it's hard to tell what is too much. I think some of the dips and bumps might NOT be noise. Thoughts?
As far as your VTEC point. Set VTEC high (like 6500). Do a 3rd gear pull til about 6000 rpm in 3rd. Set VTEC low (3500?) and do a 3rd gear pull from 3k to 8k.
Graph the two and where they intersect is going to be your vtec point, give or take a couple hundred rpm maybe. Way easier on the S2k than on the K20.
I'm doing a full cam angle tune for a Si driver and check out these cam angle overlays:
http://pics.fullavit.com/logs/galaxygrey/overlay2.png
How's that for tuning VTEC point? :lol:
We're not even done yet... still the 15/40/50 high cam angles to tune (around 50 usually makes best after 4k rpm on the Si). But as you can tell already, the 30* cam is absolutely raping the low cam (i didn't graph 50* low cam in that plot cause the car hated it)[/code]